



With application testing, delivering a seamless user experience is easier. With the growing complexity of applications and rising cyber threats, it has become necessary to perform optimally under varying load conditions while remaining secure, which has become a top priority. Performance and load testing are key to achieving this. They simulate user activity to test an application’s behavior under specific loads, helping identify bottlenecks, predict scalability, and ensure a smooth user experience. Apache JMeter is a powerful tool that can help you achieve these goals. Let’s dive into how to do performance and load testing using Jmeter.

 Once the Test Plan gets created, we can change the name of the Test Plan. Along with this, we can configure various settings of the Test Plan.
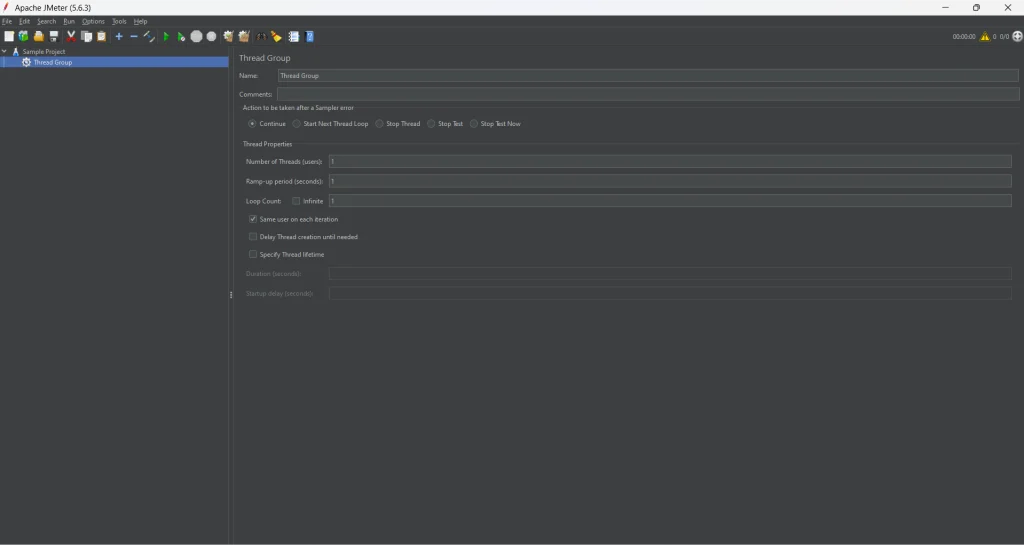
 Configure the Thread Group by setting the number of thread users, ramp-up period, and loop count for simulating user behavior and loading in the Jmeter performance testing. Adjust as needed for your specific scenario. This defines the foundation of your performance.
 Step 5: Configuring JMeter Load Testing Scenarios (Ramp-up period and Loop Count)
The ramp-up period defines how long it takes for all number of threads to start, ensuring the load is applied gradually. The loop count sets how many times each thread will execute the load test. Arranging these values properly helps simulate realistic user behavior and achieve accurate performance insights from testing.
Step 5: Configuring JMeter Load Testing Scenarios (Ramp-up period and Loop Count)
The ramp-up period defines how long it takes for all number of threads to start, ensuring the load is applied gradually. The loop count sets how many times each thread will execute the load test. Arranging these values properly helps simulate realistic user behavior and achieve accurate performance insights from testing.

 To start the test, click on the “Run” menu, then select “Start,” or press the “Play” button. Monitor the test progress in the listeners you have added to analyze the performance metrics.
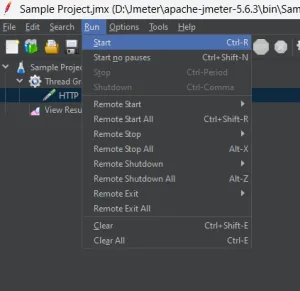 Clicking on the Start button, which is situated at the top of the option bar as shown in the below image.
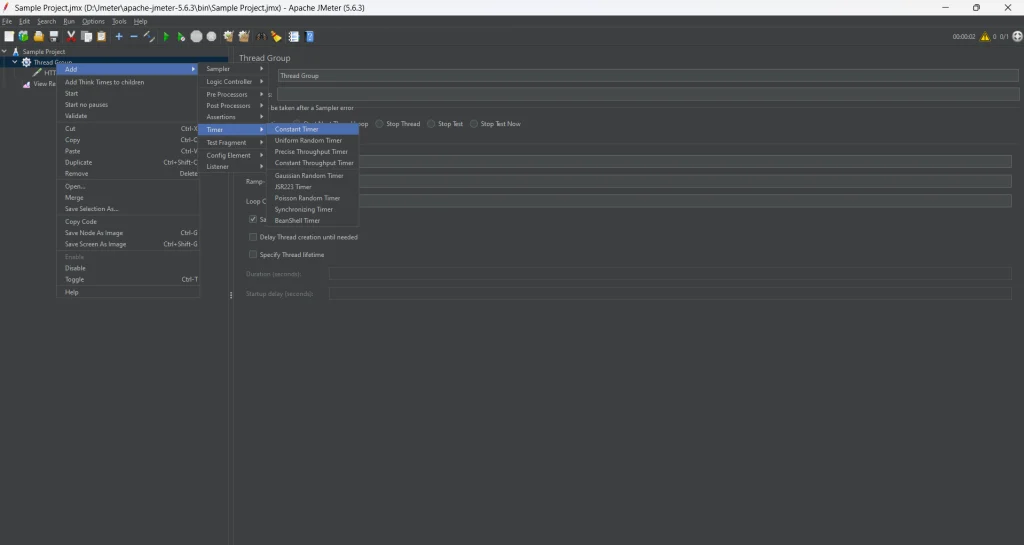 To prevent this, you can configure a thread delay of 5000 milliseconds in Jmeter between requests for more realistic load testing.
Prerequisites
Before we start performance testing and load testing using Jmeter, let us understand more about Apache Jmeter.1. What is Apache JMeter? How to use JMeter?
Apache JMeter, developed by Stefano Mazzocchi under the Apache Software Foundation, is an open-source Java application designed for testing the performance of static and dynamic resources, web applications, and database servers. Features- Open-source Software: Its code is publicly available.
- Platform-independent: Works on any system supporting a Java Virtual Machine (JVM).
- Supports multiple testing techniques: From load testing to functional testing, covering various protocols.
- User-friendly: A GUI similar to a web browser.
- Highly extensible: Supports plugins for advanced visualization and test customization.
Steps to Perform Performance Testing & Load Testing using JMeter
Step 1: Launch and start Jmeter Testing
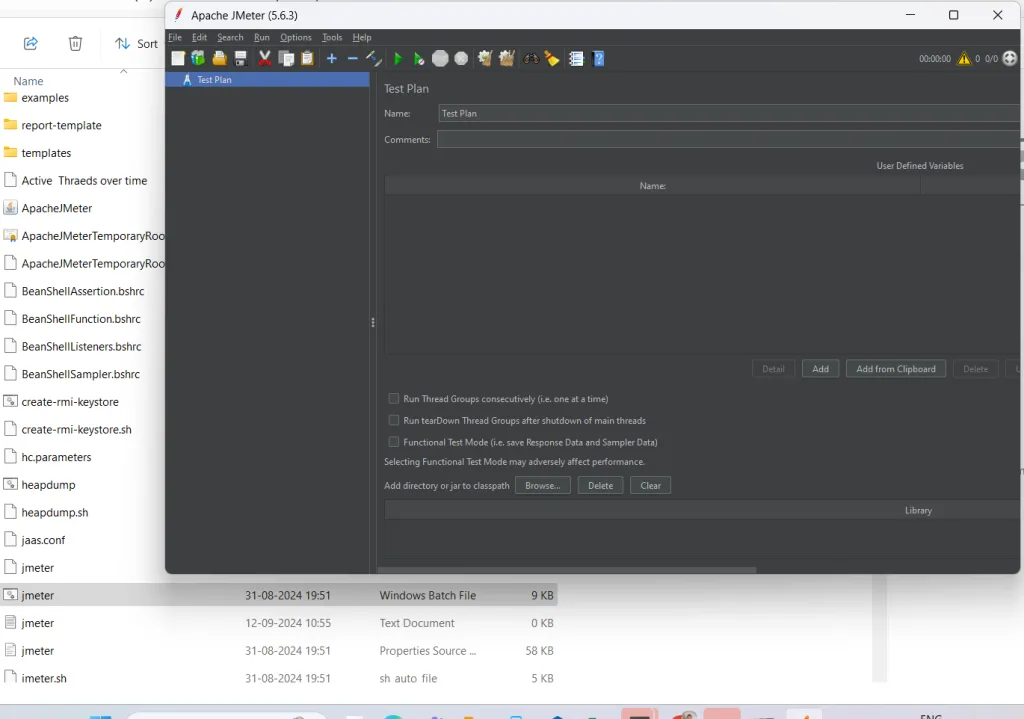
Ensure Java is installed on your system before downloading JMeter. Extract the downloaded archive and launch it using the JMeter Windows Batch file in the ‘bin’ directory. Let’s begin load testing.
Step 2: Create a new Jmeter testing Test Plan
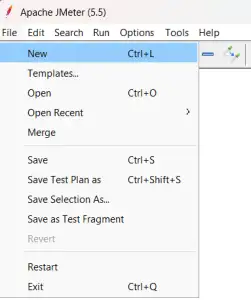
Open JMeter, navigate to File -> New Test Plan to create a test plan, and provide a name for your test plan to create a new JMeter test plan project within the JMeter interface.
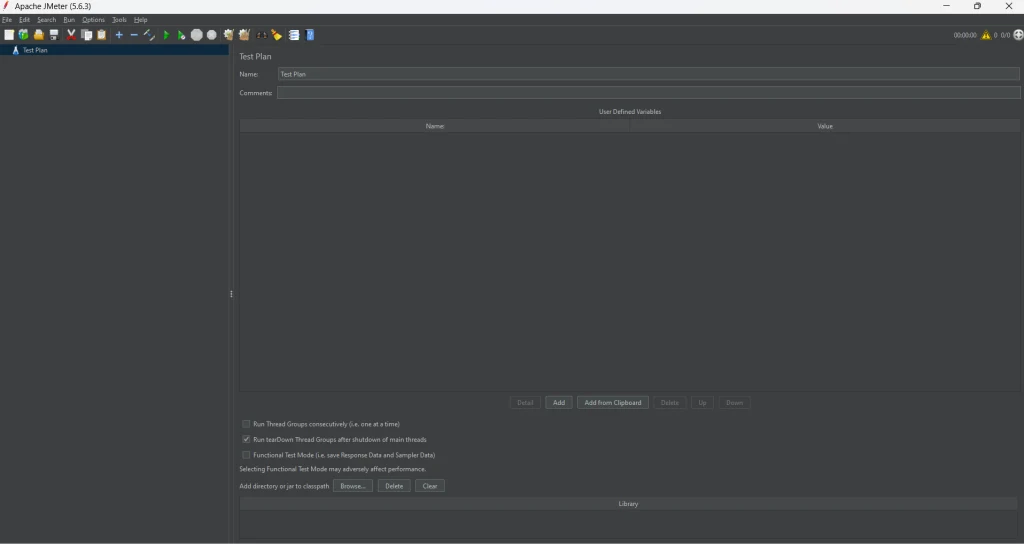
Once the Test Plan gets created, we can change the name of the Test Plan. Along with this, we can configure various settings of the Test Plan.
Step 3: Add a Thread Group
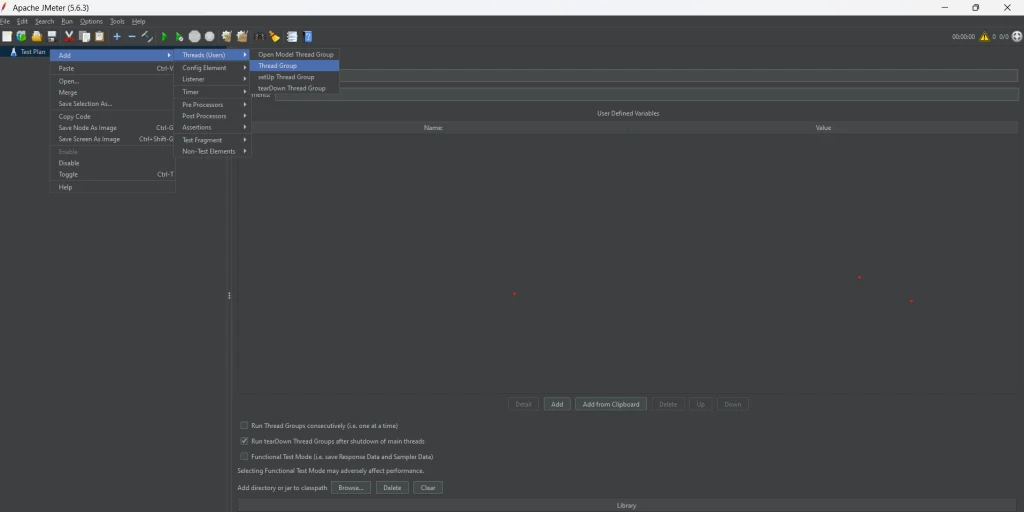
In the Test Plan, right-click and select Add -> Threads (Users) -> Thread Group in the tree view
Configure the Thread Group by setting the number of thread users, ramp-up period, and loop count for simulating user behavior and loading in the Jmeter performance testing. Adjust as needed for your specific scenario. This defines the foundation of your performance.
Step 4: Add Sampler (HTTP Request) in JMeter Performance Testing
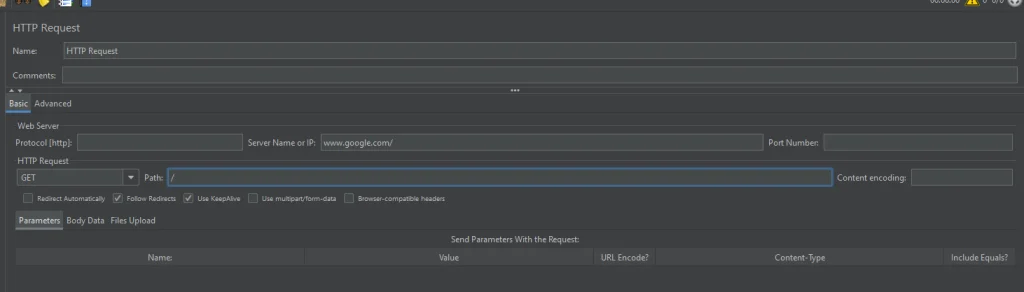
Inside the Thread Group, right-click and choose Add -> Sampler -> HTTP Request to add an HTTP Request Sampler. To configure the sampler, input specific server details, including the server name, port number, and path. These details help JMeter simulate HTTP requests during the performance test. For instance, when testing the GeeksforGeeks website, its web server name was used along with the root path (‘/’) to assess the website’s overall performance. This approach allows you to analyze how the server handles requests and delivers responses while testing. Important note: while HTTP requests are commonly used, it supports various other protocols, making it adaptable for different types of JMeter performance testing and load-testing scenarios. By tailoring the sampler settings, you can ensure your test accurately mimics real-world user interactions. Remember to correctly specify details of the server name or IP, port, and path.
Step 5: Configuring JMeter Load Testing Scenarios (Ramp-up period and Loop Count)
The ramp-up period defines how long it takes for all number of threads to start, ensuring the load is applied gradually. The loop count sets how many times each thread will execute the load test. Arranging these values properly helps simulate realistic user behavior and achieve accurate performance insights from testing.
Step 6: Add Listeners
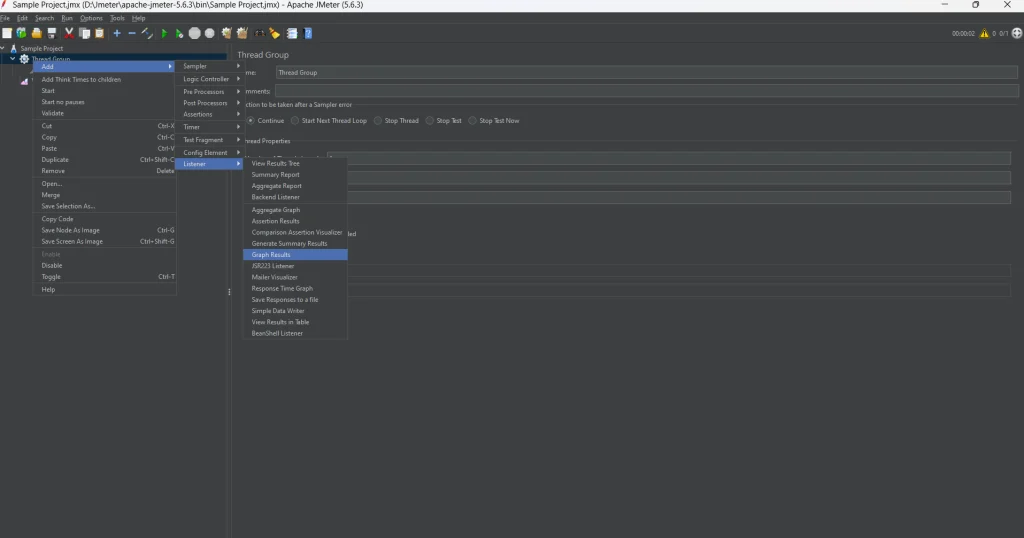
Right-click within the Thread Group and select Add -> Listener. Choose common listeners like View Results Tree, Summary Report, or Response Times Over Time to display key test result data. Configure them to monitor and analyze performance metrics effectively after the test. Step 7: Configure Additional Elements (Optional) If necessary, enhance your performance and load test with additional elements by adding Config Elements to set variables, assertions to validate responses, and Timers to introduce delays between request times. Customize these elements based on your specific test requirements.9. Graph Result
Visualize performance testing metrics by accessing the graph results in the tree view. The given graphs in Jmeter represent data related to IP addresses, threads, loops, and other parameters, allowing you to analyze the behavior of your application under load. The graphical representation provides a clear understanding of system performance trends and potential bottlenecks. Therefore, in simple terms, what exactly JMeter is capable of doing or aimed to do is that it forms a request and forwards it to the server. Once it receives the server’s response, it gathers them and can display that detail in the form of a chart or a graph.
Step 10: Run the Test
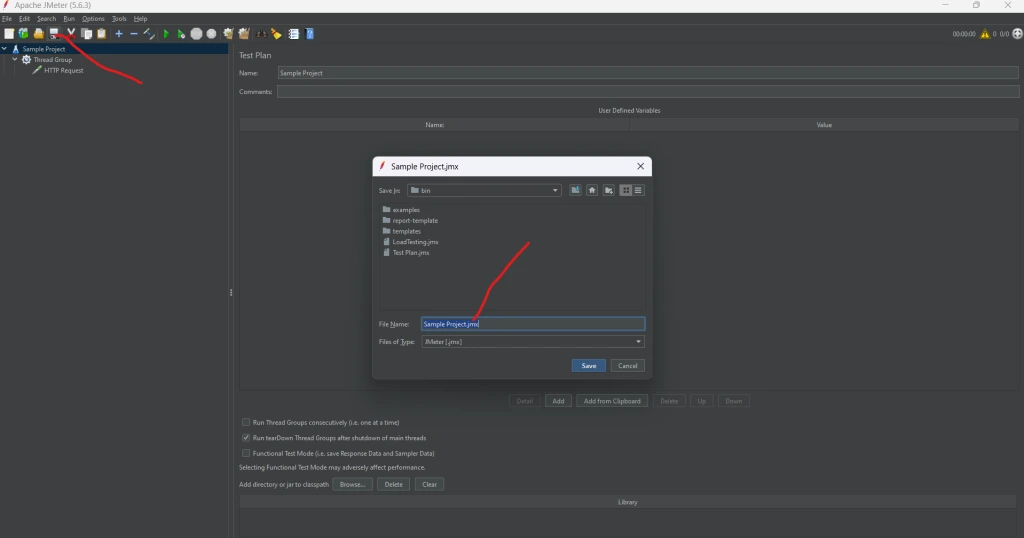
Once you’ve set up your test plan, save it by selecting File -> Save Test Plan and giving it a meaningful name.
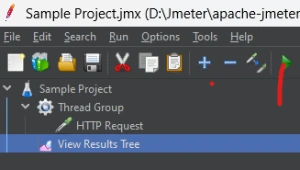
To start the test, click on the “Run” menu, then select “Start,” or press the “Play” button. Monitor the test progress in the listeners you have added to analyze the performance metrics.
Clicking on the Start button, which is situated at the top of the option bar as shown in the below image.
Jmeter Timers: Constant, Gaussian Random, Uniform
By default, JMeter sends the request without pausing between each request. In that case, JMeter could overwhelm your test server by making too many requests in a short amount of time.
To prevent this, you can configure a thread delay of 5000 milliseconds in Jmeter between requests for more realistic load testing.
Add View Results in Table
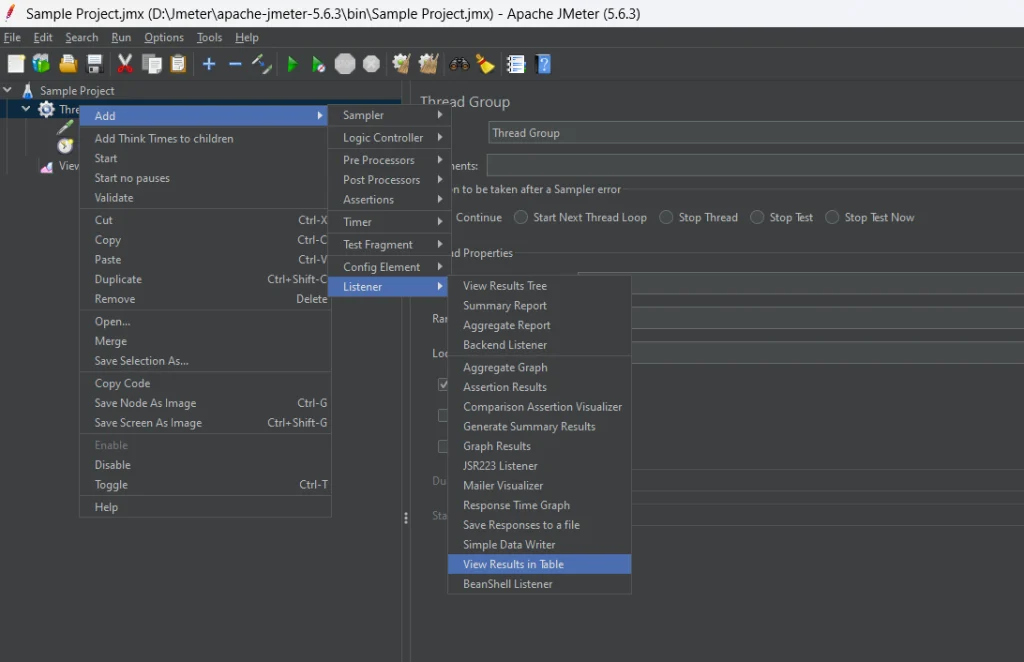
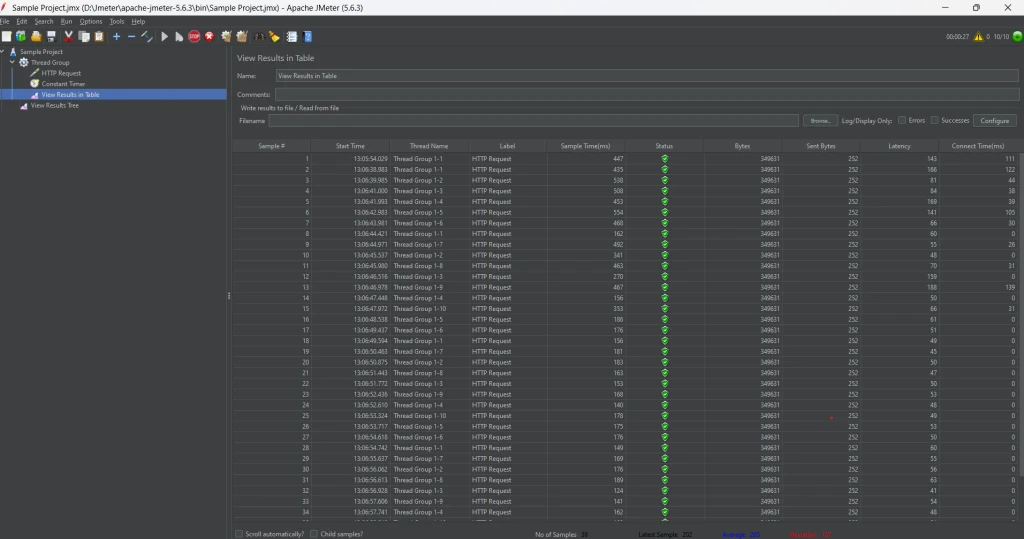
To view the test results in a table format, right-click in the Thread Group and add the View Results in Table listener. Right click Add -> Listener ->View Result in Table
Run your test
Once everything is set, click the Run button on the menu bar or short-key Ctrl+R to execute the test and observe the results as they are displayed in the below image.